-

-

-

-

-

-

-
 MAP
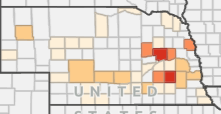
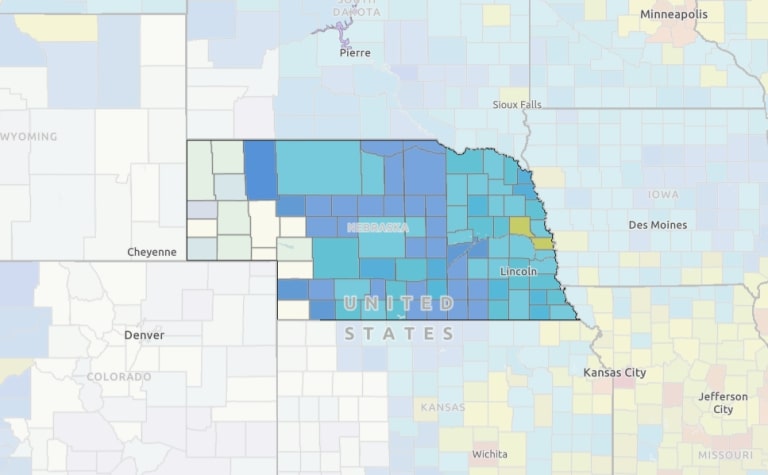
MAPHeat Wave Risk Map
This map shows the heat wave risk by county, as well as the community susceptibility by county. Counties with overlapping high community susceptibility and increased heat wave risk ratings have populations that are more inclined to suffer heat-related injuries.
-
 MAP
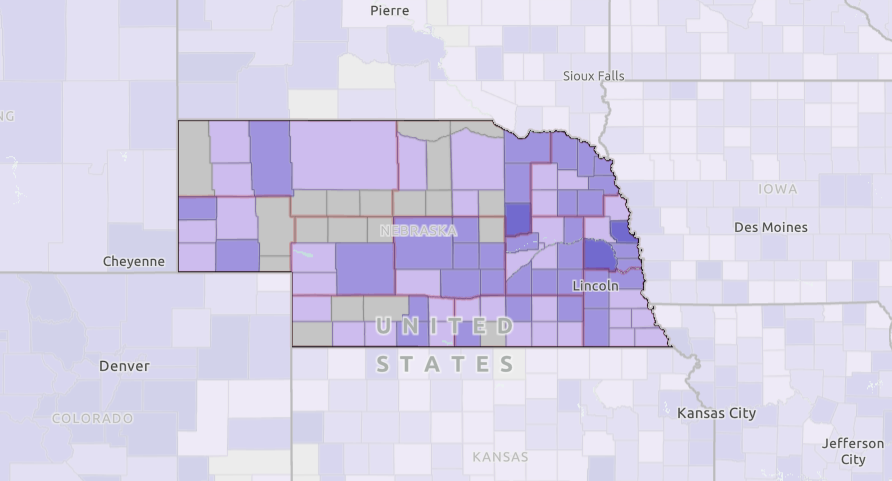
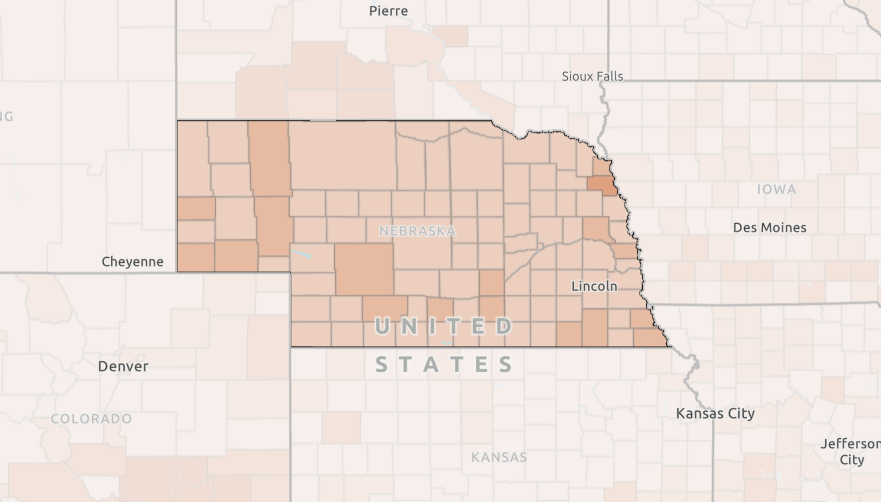
MAPHouseholds Receiving SNAP Benefits
This map shows households receiving SNAP benefits as reported by the American Community Survey (ACS 2018-2022)
Category: Program Areas