-
 MAP TOOL
Nebraska Map Room
The Nebraska Map Room hosts more than 30,000 data layers from federal, state, and local sources.
-
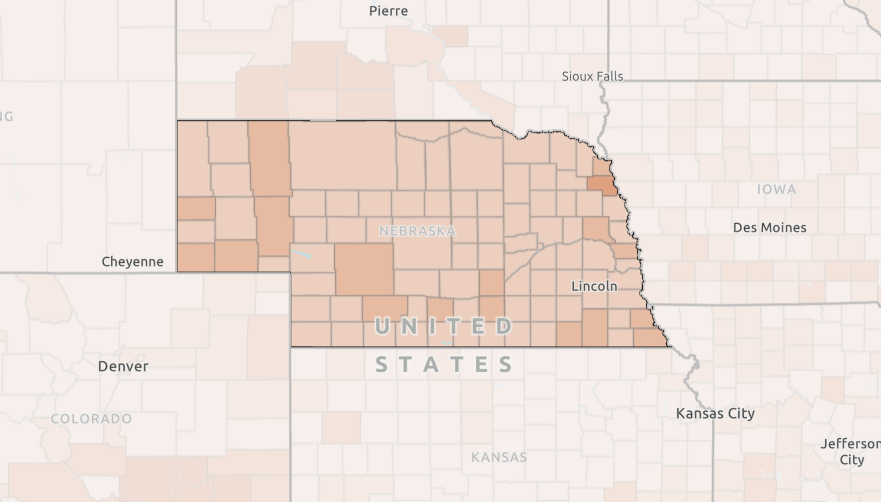
 MAP
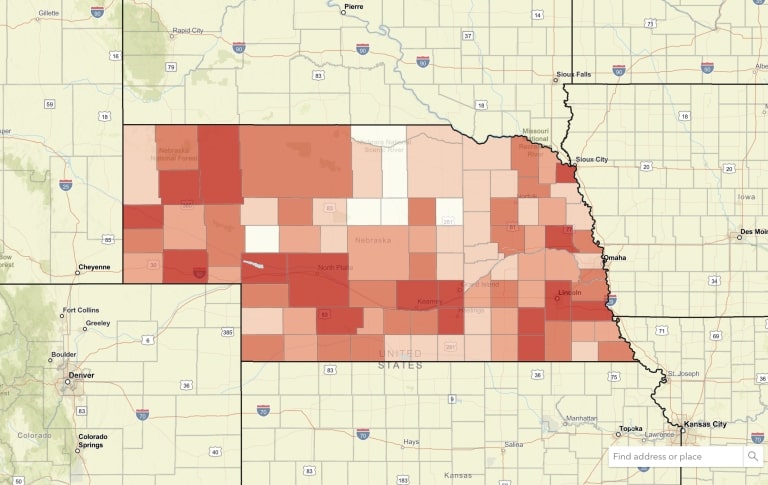
MAPHeat Exposure Map
This map shows the days per year with heat exposure of 90 degrees or higher by county or census tract.
-
 MAP
MAPBroadband Access
This map displays broadband access as reported by the American Community Survey and as reported by the Federal Communications Commission.
-
 MAP
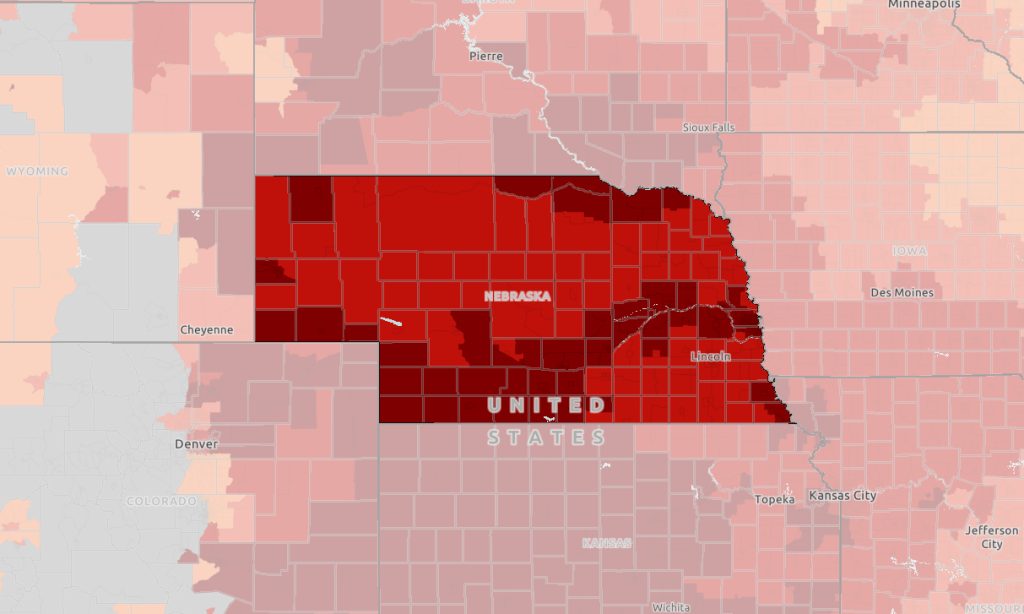
MAPHeat Wave Risk Map
This map shows the heat wave risk by county, as well as the community susceptibility by county. Counties with overlapping high community susceptibility and increased heat wave risk ratings have populations that are more inclined to suffer heat-related injuries.
-
 MAP
MAPTar Spot Appearance by County
Tar spot is a disease caused by the fungus Phyllachora maydis, and can negatively impact crop yields. This layer tracks the appearance of tar spot of corn by county for the current year.
-
 MAP
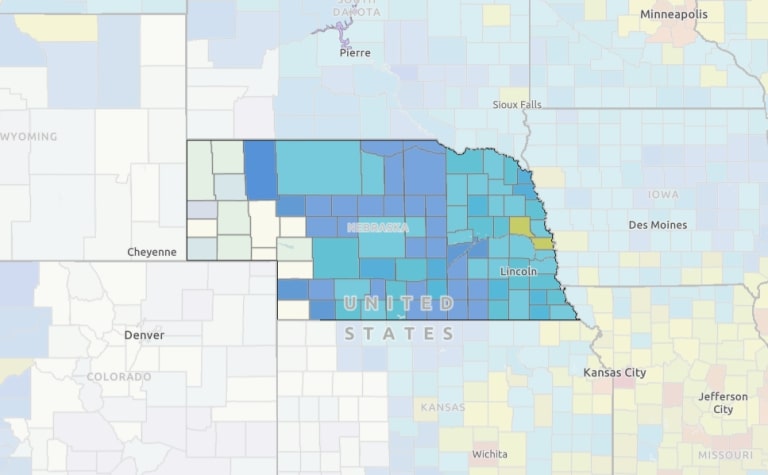
MAPHouseholds Receiving SNAP Benefits
This map shows households receiving SNAP benefits as reported by the American Community Survey (ACS 2018-2022)
-
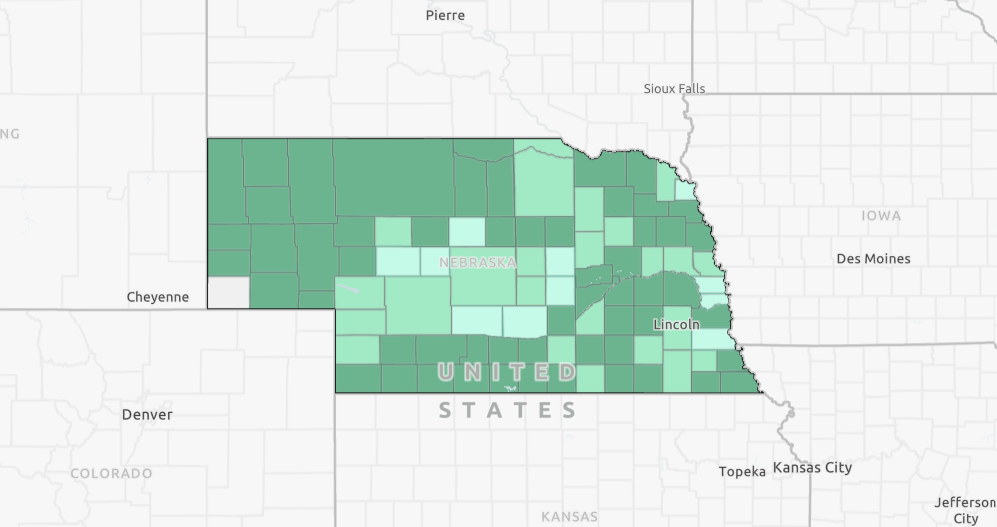
 MAP
MAPNebraska 4-H % Reach by County, 2024
This county-level map displays the percentage of youth reached by 4H programs. The data for the map is sourced from 4H Online.
-
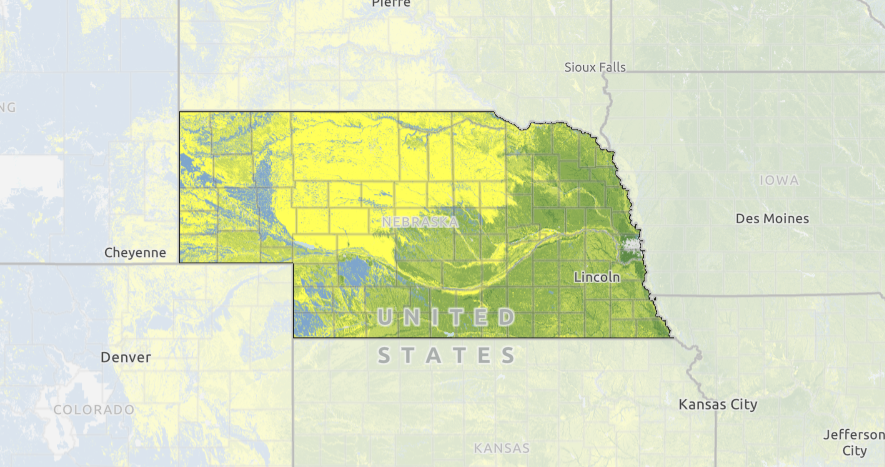
 MAP
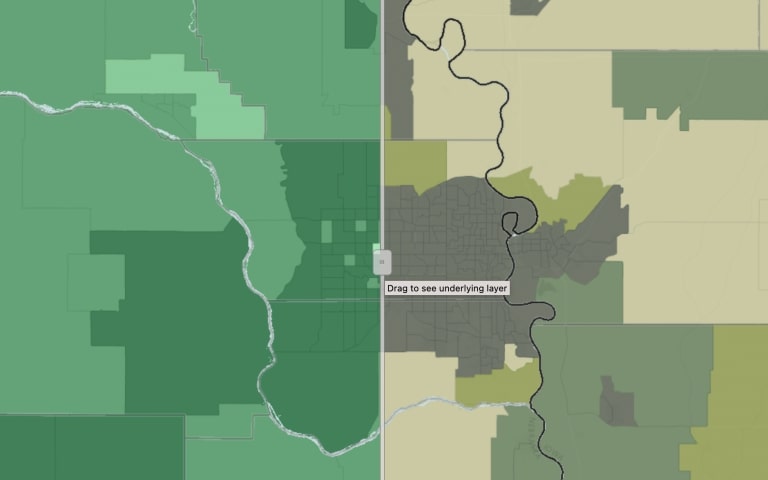
MAPCrop Productivity
This map shows the ability of soils, landscapes, and weather to foster crop productivity. The are based on productivity for four crops: corn, soybeans, small grains, or cotton.