-

-

-
 MAP
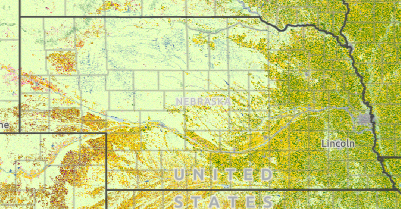
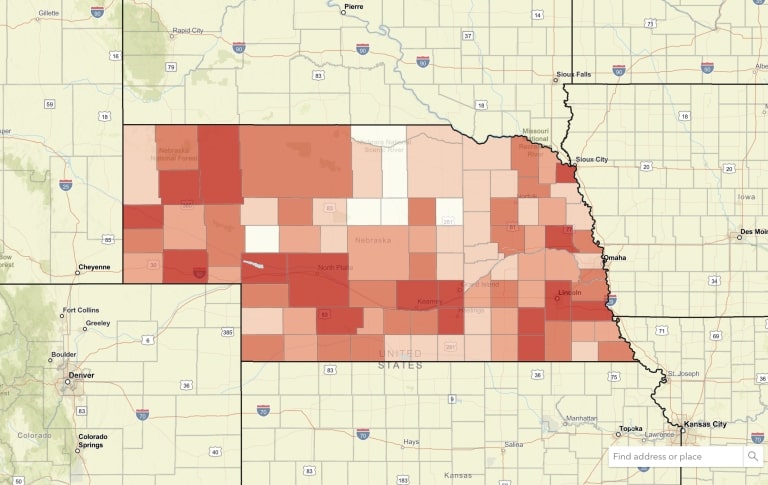
MAPCash Rents by Land Type
This map shows cash rent values by type of land. Land types include irrigated cropland, non-irrigated cropland, and pastureland. The data in this map come from the USDA National Agriculture Statistics Service (NASS).
-
 TOOL REPORT
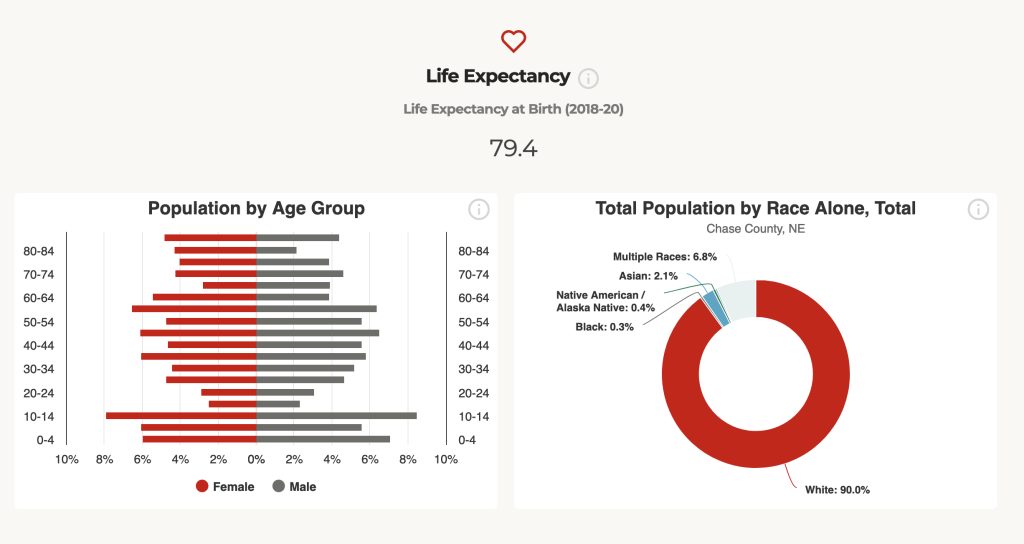
County Report Cards
The Nebraska County Report Cards provide population, income, workforce and other related data for every county in Nebraska. The Report Cards can be easily downloaded and shared.
-
 MAP
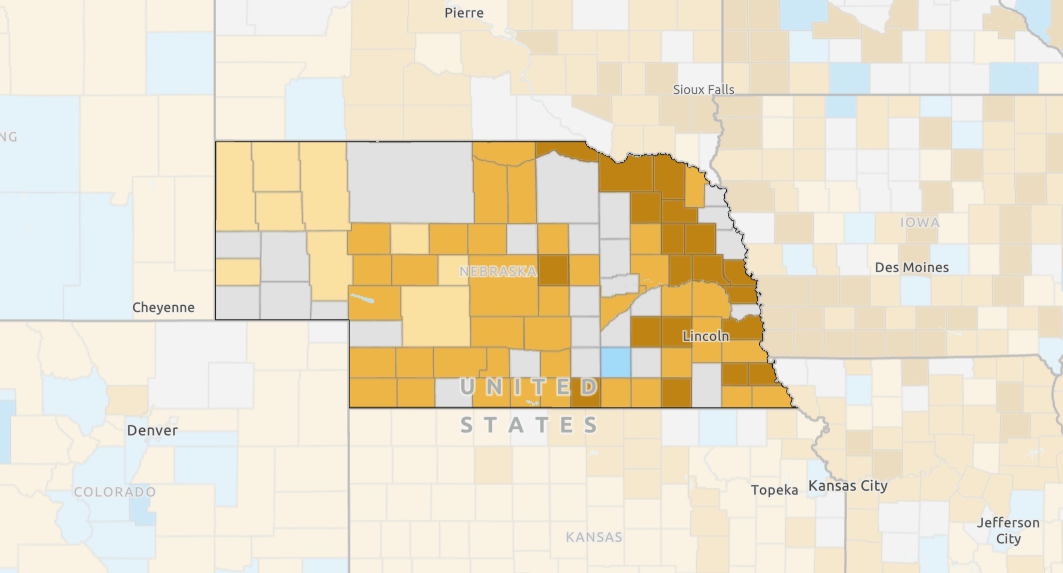
MAPTop Agricultural Commodity by County
This map displays data from the 2022 Census of Agriculture. The data show the top agricultural commodity in each county.
-
 MAP
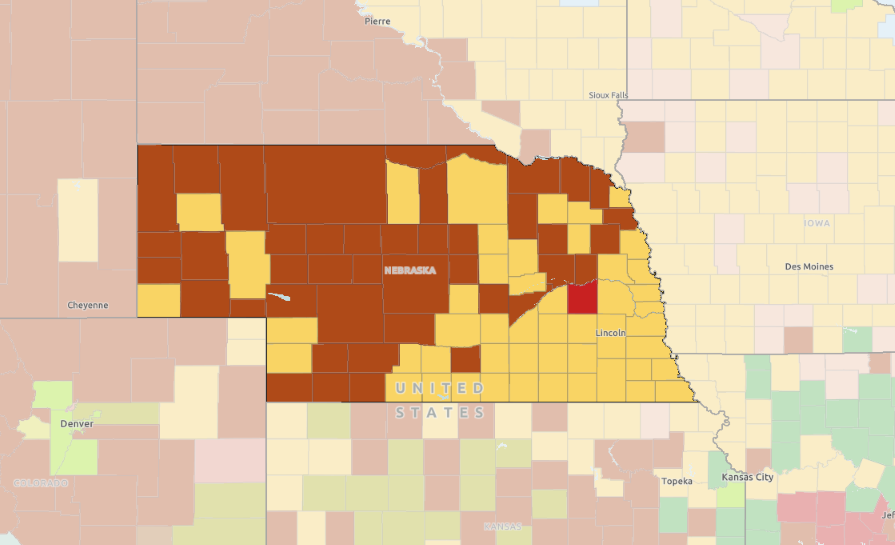
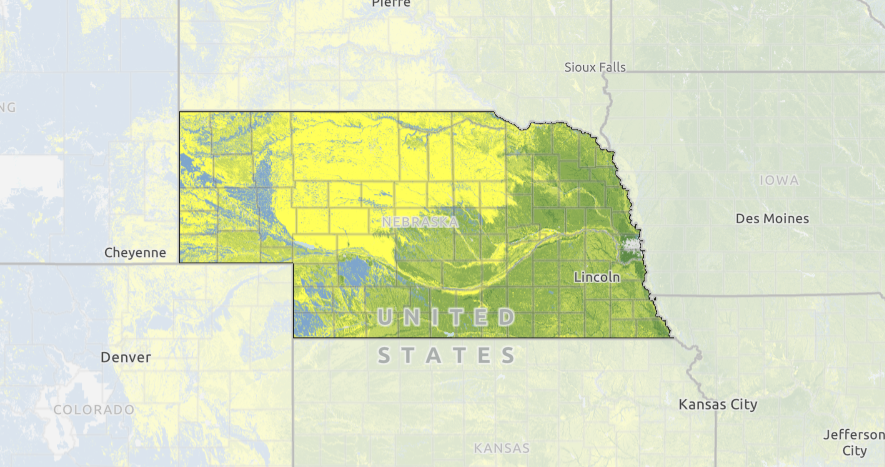
MAPCrop Productivity
This map shows the ability of soils, landscapes, and weather to foster crop productivity. The are based on productivity for four crops: corn, soybeans, small grains, or cotton.
-

-
 MAP TOOL
Nebraska Map Room
The Nebraska Map Room hosts more than 30,000 data layers from federal, state, and local sources.
Category: Agricultural Profitability
All Things Nebraska resources related to the Agricultural Profitability program area in Nebraska Extension.