-
 MAP
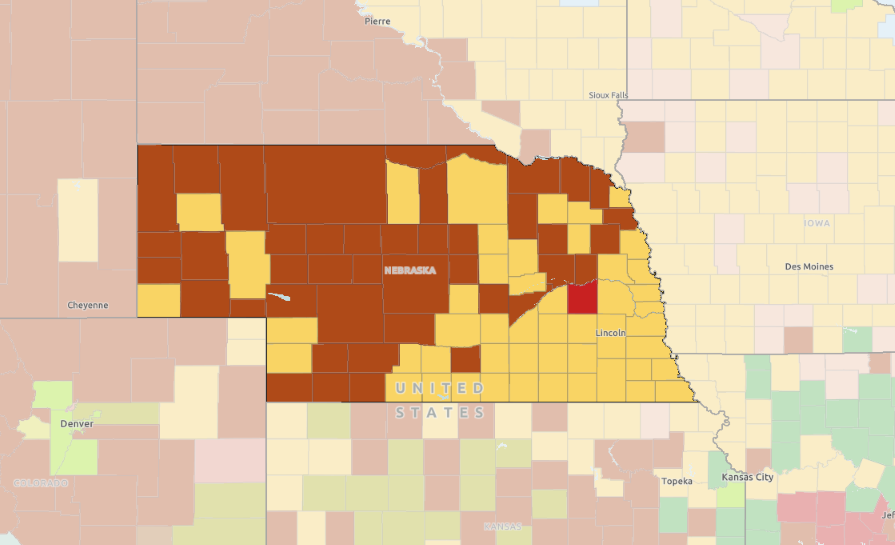
MAPHeat Wave Risk Map
This map shows the heat wave risk by county, as well as the community susceptibility by county. Counties with overlapping high community susceptibility and increased heat wave risk ratings have populations that are more inclined to suffer heat-related injuries.
-
 TOOL REPORT
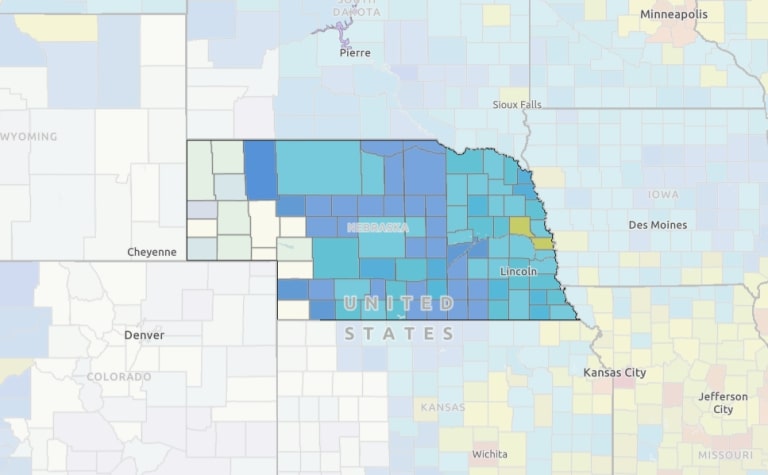
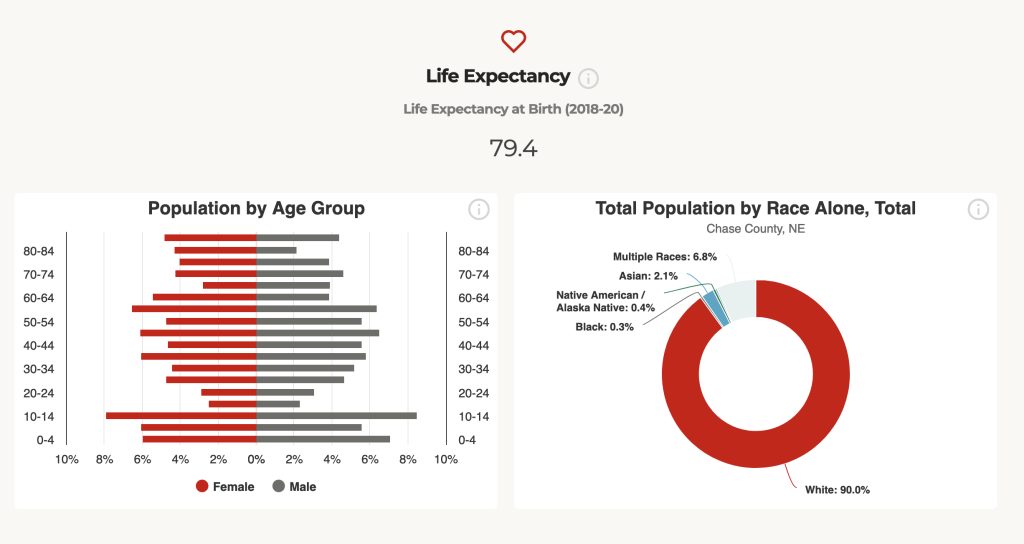
County Report Cards
The Nebraska County Report Cards provide population, income, workforce and other related data for every county in Nebraska. The Report Cards can be easily downloaded and shared.
-

-

-
 MAP
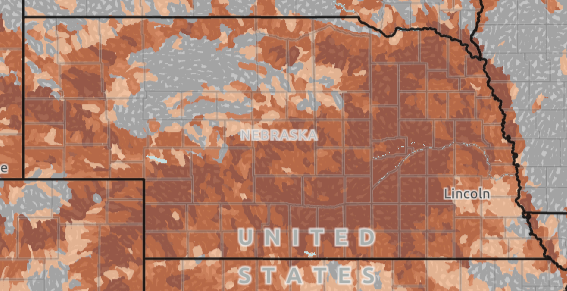
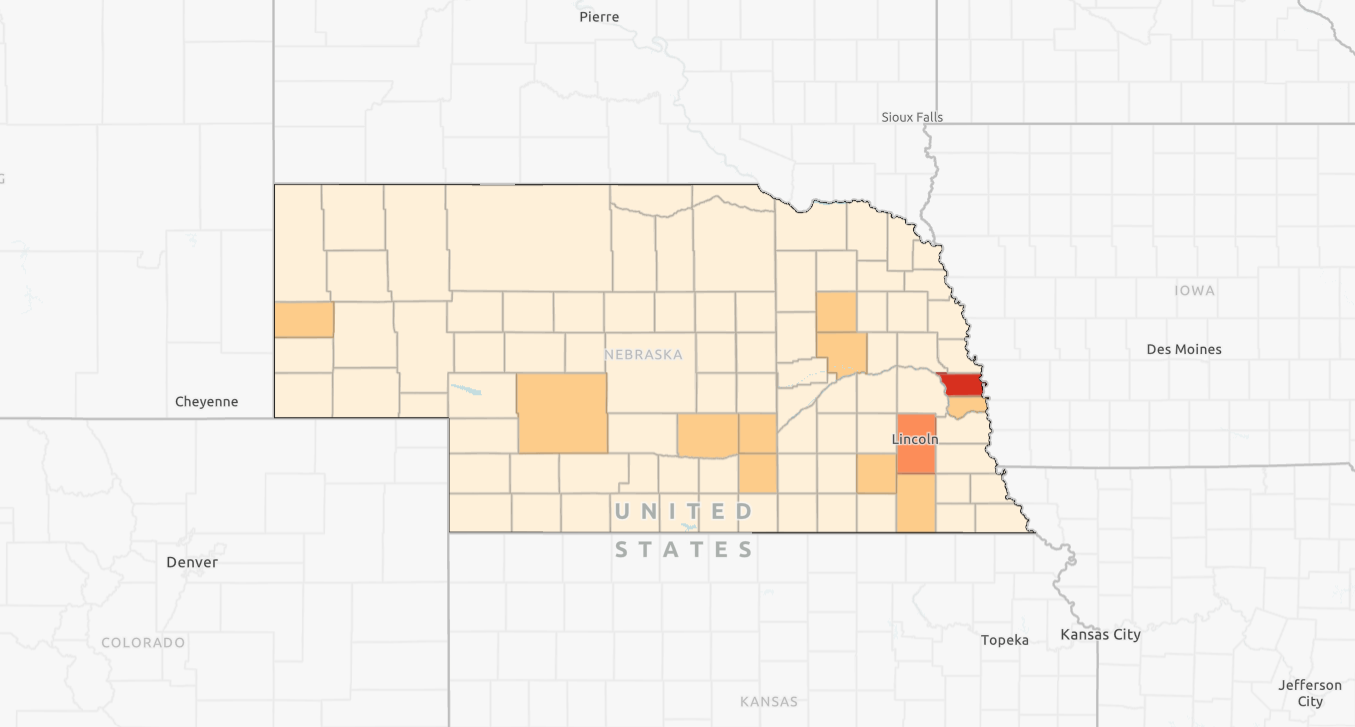
MAPTop Agricultural Commodity by County
This map displays data from the 2022 Census of Agriculture. The data show the top agricultural commodity in each county.
-
 MAP
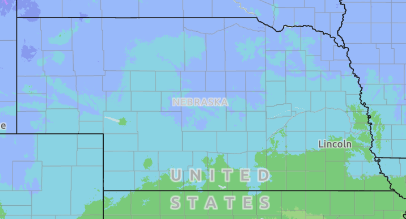
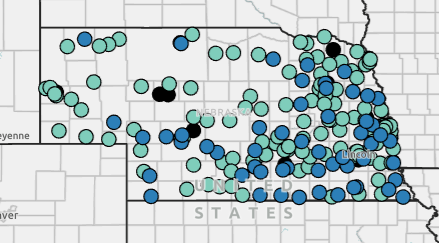
MAPPer Pupil Expenditures
This map shows the per pupil expenditure for each school district in Nebraska. The data are sourced from the Nebraska Department of Education.
-

-

Category: Horticulture, Landscape, and Environmental Systems
All Things Nebraska resources related to the Horticulture, Landscape, and Environmental Systems program area in Nebraska Extension.