Skip to main content
An Affiliate of the University of Nebraska–Lincoln
Translate
English
Arabic
Chinese (Simplified)
Dutch
English
French
German
Hindi
Italian
Lao
Marathi
Nepali
Portuguese
Russian
Somali
Spanish
Swahili
Thai
Ukrainian
Vietnamese
Log In
Search All Things Nebraska
Institute of Agriculture and Natural Resources
|
Nebraska Extension
All Things Nebraska
Menu
Search
Log In
Translate
All Things Nebraska
About
Accessibility Statement
Maps
Nebraska Map Room
Map Room Support
Map Gallery
Engagement and Outreach Map
Tools
Tool Gallery
Nebraska County Report Card
Nebraska Rural Poll Interactive Report
Reports
Report Gallery
Nebraska Housing Report
County Health Rankings Report
County Health Rankings Report Support
Explore by Topic
Agriculture and Natural Resources
Business and Economic Development
Disaster Education
Local Government
Nebraska Extension Program Areas
Our Health
Schools and Youth
Close
Search All Things Nebraska
IANR
Nebraska Extension
All Things Nebraska
Program Areas
Category:
Program Areas
Map
Report
Tool
Filter
MAP
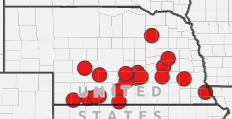
2025 TAPS Continuous Corn Participants
MAP
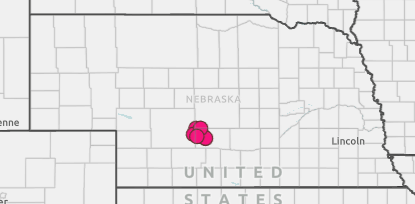
2025 TAPS Sprinkler Corn Participants – Eastern Nebraska Research and Extension Education Center
MAP
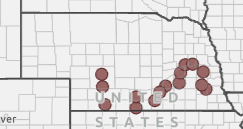
2025 TAPS Food Grade Corn Participants
MAP
2025 2025 TAPS Nitrogen Source Participants
MAP
2025 TAPS Soybean Participants
MAP
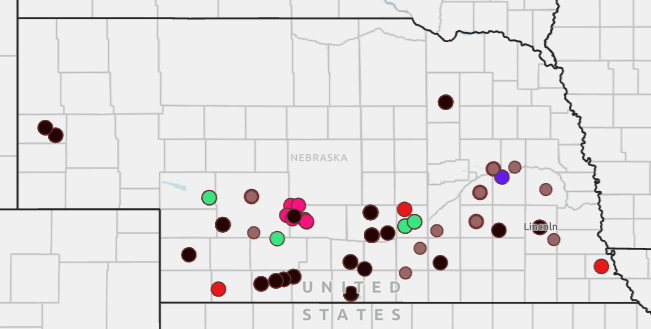
All 2025 TAPS Participant Locations
MAP
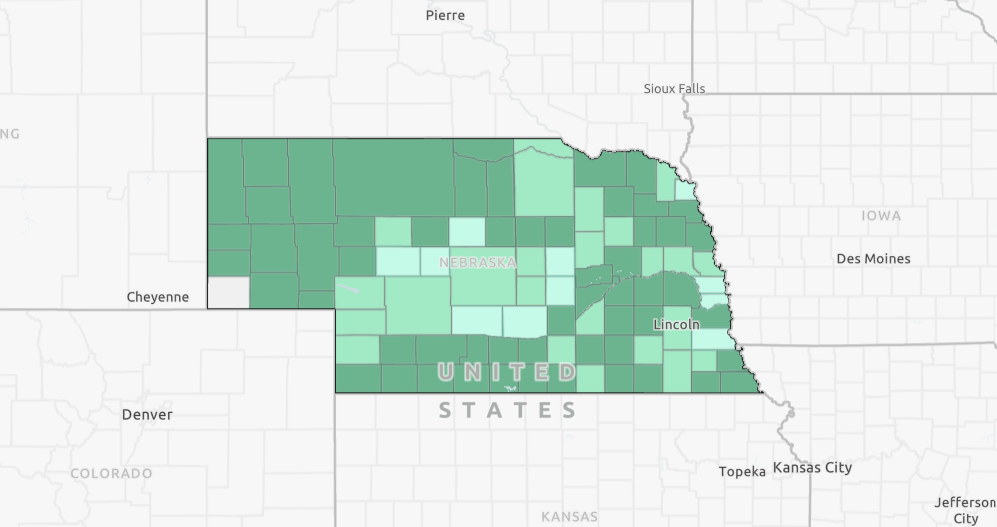
Nebraska 4-H % Reach by County, 2025
MAP
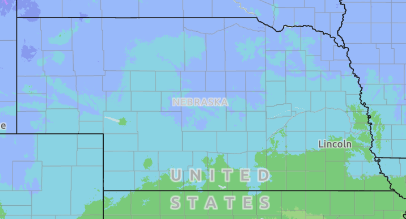
Plant Hardiness Zone Map
Posts navigation
Previous
1
…
3
4
5
…
11
Next