-
 MAP
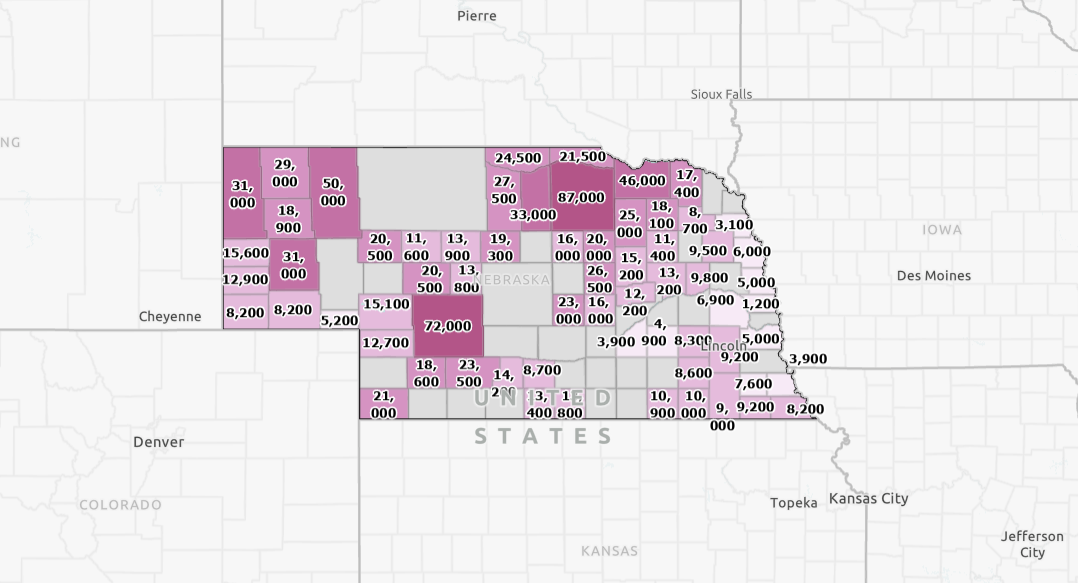
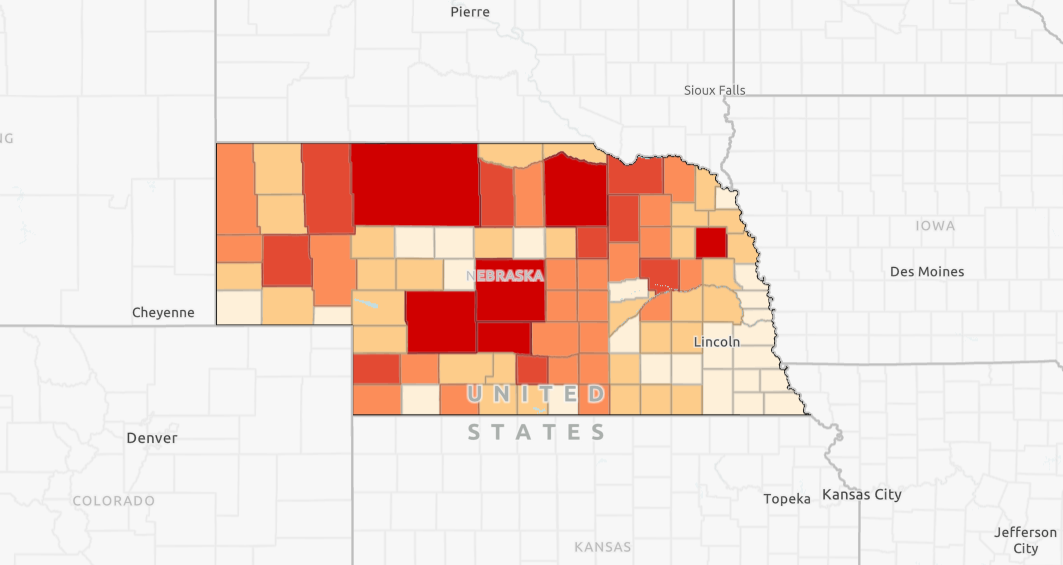
MAPCattle and Calf Inventory
This map shows Nebraska cattle and calf inventory by county based on 2023 data from the USDA National Agricultural Statistics Service.
-
 MAP
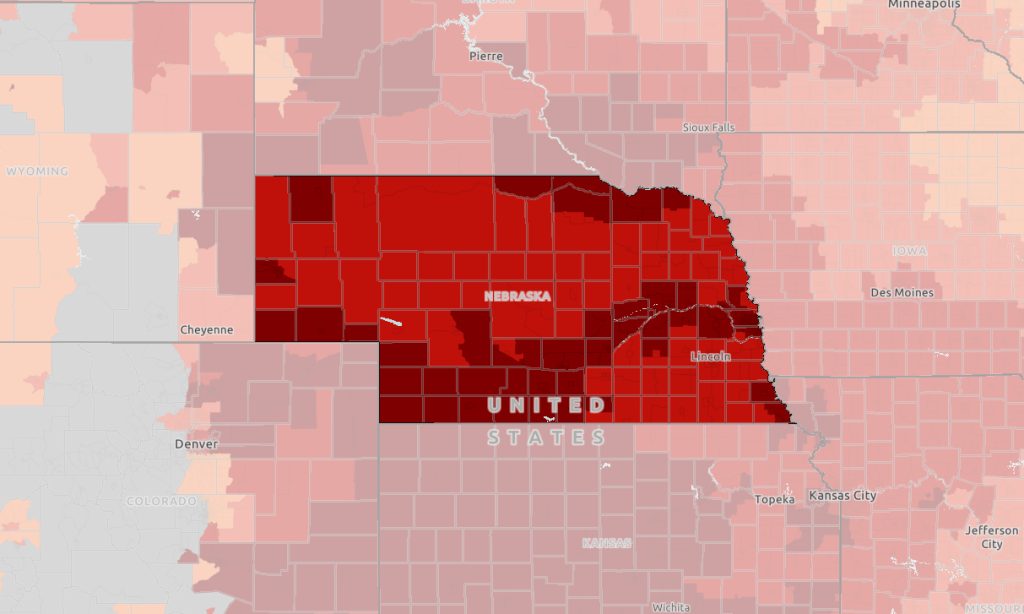
MAPBeef Cattle Production
This map shows Nebraska beef production by county based on 2024 data from the USDA National Agricultural Statistics Service.
-
 MAP
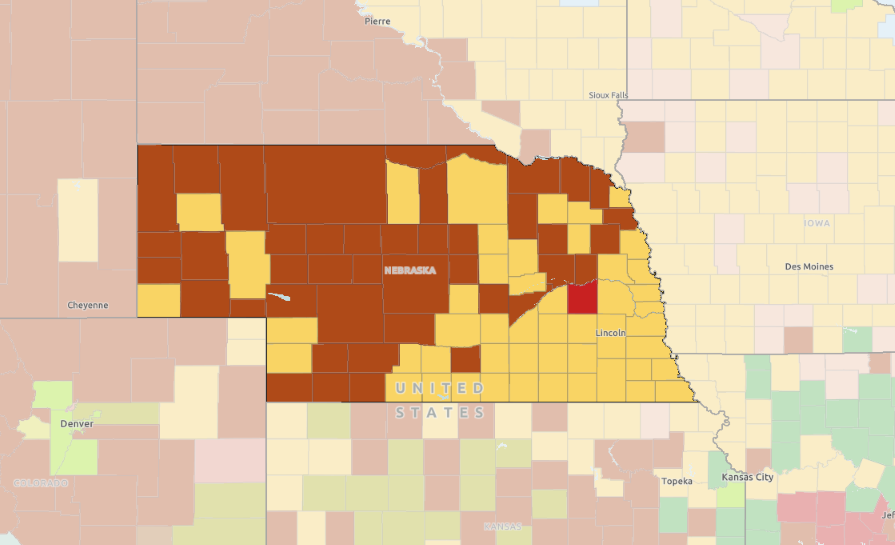
MAPHeat Exposure Map
This map shows the days per year with heat exposure of 90 degrees or higher by county or census tract.
-
 MAP
MAPTar Spot Appearance by County
Tar spot is a disease caused by the fungus Phyllachora maydis, and can negatively impact crop yields. This layer tracks the appearance of tar spot of corn by county for the current year.
-
 MAP
MAPTop Agricultural Commodity by County
This map displays data from the 2022 Census of Agriculture. The data show the top agricultural commodity in each county.
-
 MAP
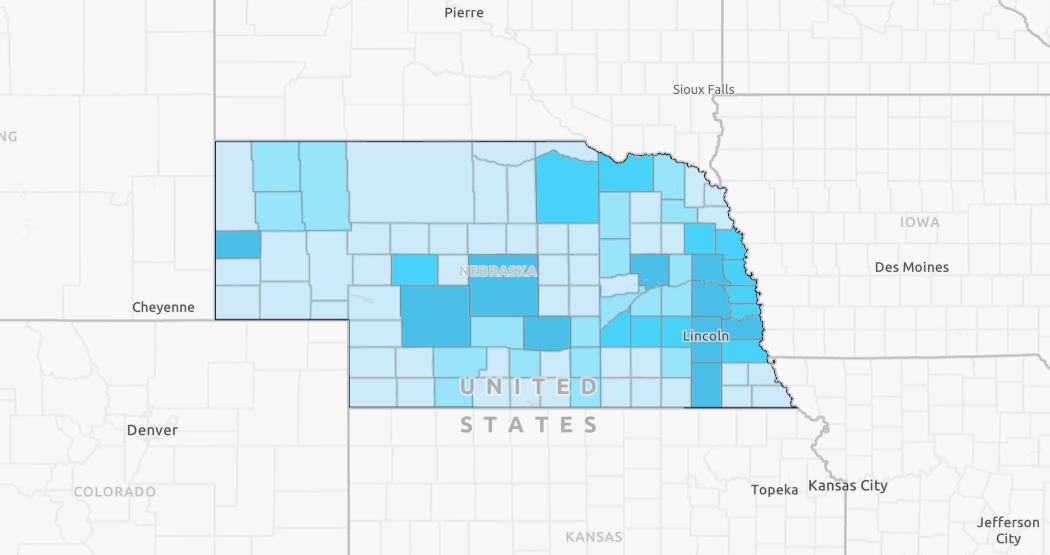
MAPNebraska 4-H % Reach by County, 2023
This county-level map displays the percent of youth reached by 4H programs. The data for the map are sourced from 4H Online.
-
 MAP
MAP4-H Youth Engagement by County
This map displays the number of youth engaged in 4H clubs by county. Data for this map comes from 4H Online.
-
 MAP
MAPPer Pupil Expenditures
This map shows the per pupil expenditure for each school district in Nebraska. The data are sourced from the Nebraska Department of Education.
Category: Program Areas