-
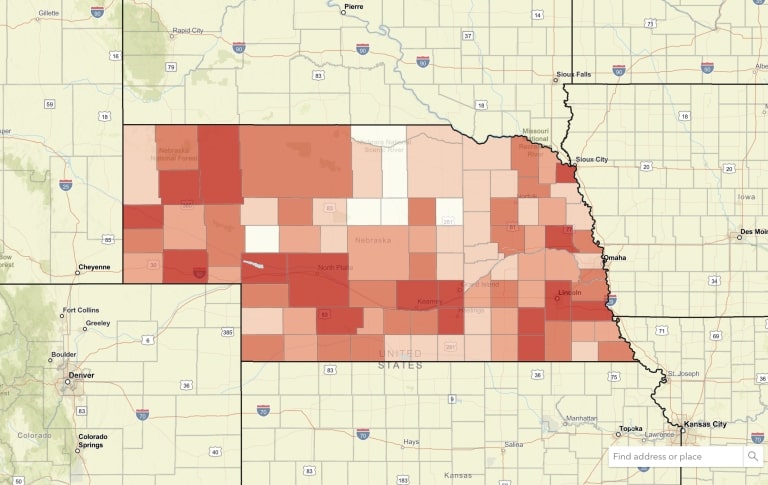
Tar Spot Appearance by County
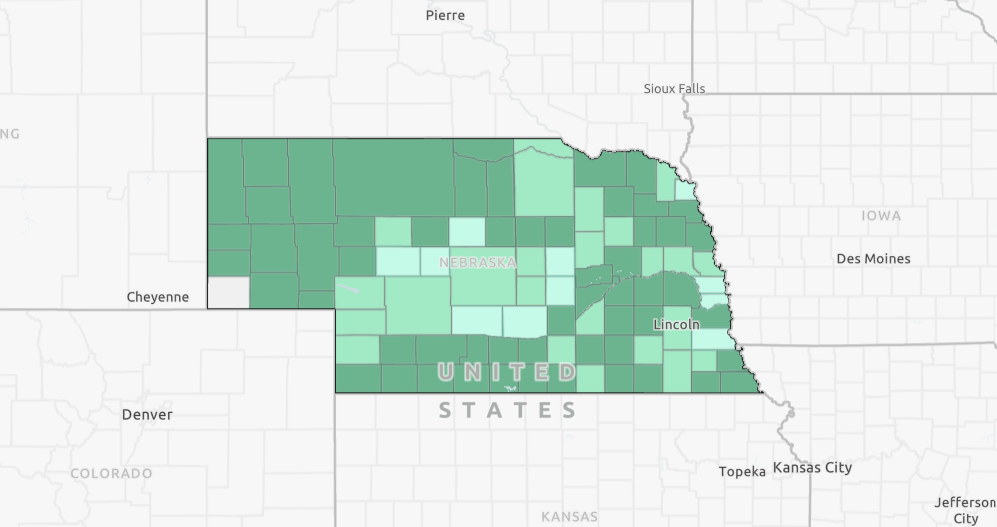
Tar spot is a disease caused by the fungus Phyllachora maydis, and can negatively impact crop yields. This layer tracks the appearance of tar spot of corn by county for the current year.
-
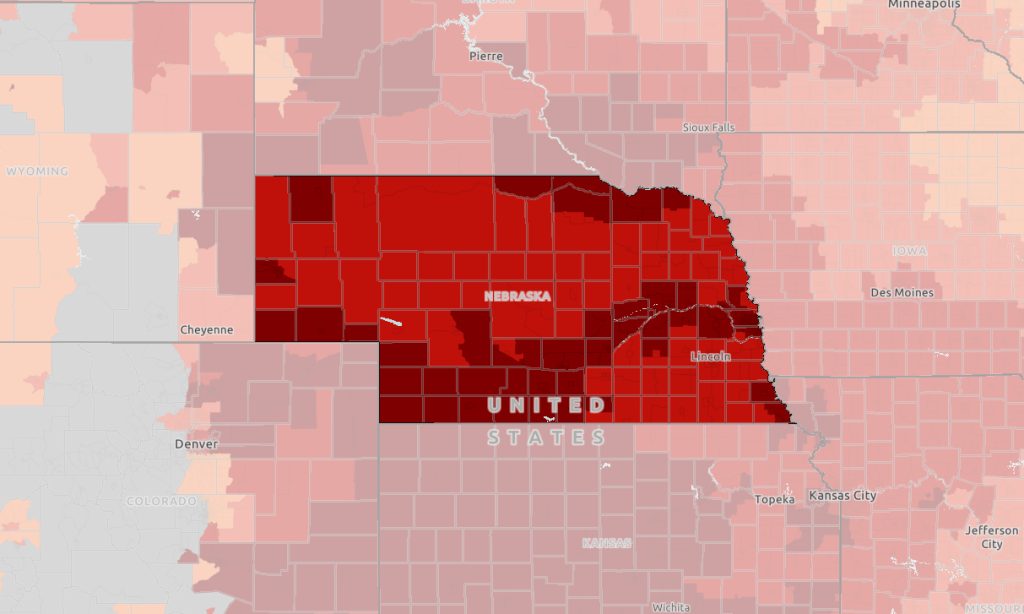
Heat Exposure Map
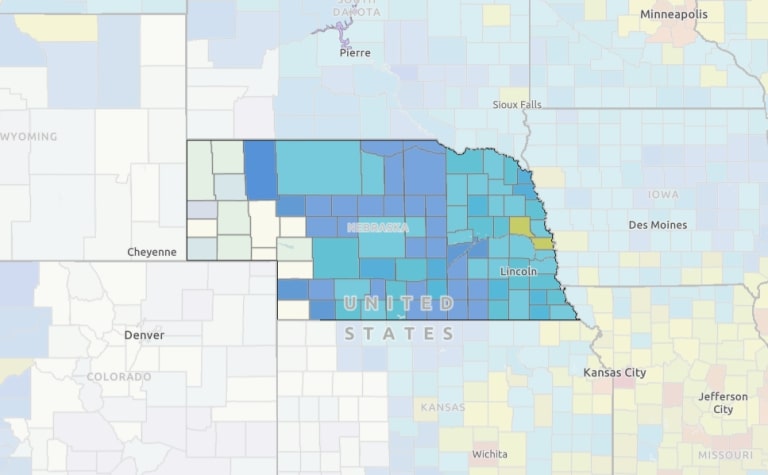
This map shows the days per year with heat exposure of 90 degrees or higher by county or census tract.
-
Nebraska Map Room
The Nebraska Map Room hosts more than 30,000 data layers from federal, state, and local sources.
in: 4-H Youth Development, Agricultural Profitability, College of Agricultural Sciences and Natural Resources, College of Architecture, College of Arts and Sciences, College of Business, College of Education and Human Sciences, College of Engineering, College of Journalism and Mass Communication, College of Law, Colleges, Disaster Education, Early Childhood, Entrepreneurship, Food, Nutrition & Health, Hixon-Lied College of Fine and Performing Arts, Horticulture, Landscape, and Environmental Systems, Livestock Systems, Program Areas, Rural Prosperity Nebraska, Water and Cropping Systems
-
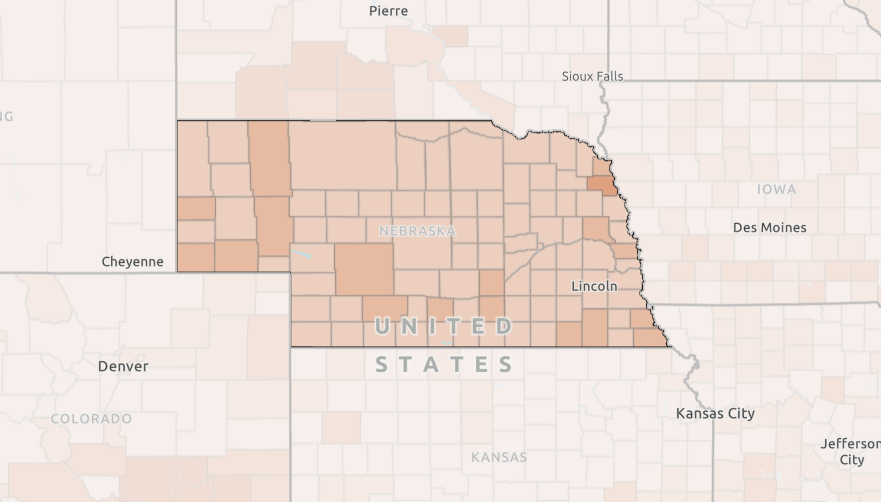
Households Receiving SNAP Benefits
This map shows households receiving SNAP benefits as reported by the American Community Survey (ACS 2018-2022)
-
Crop Productivity
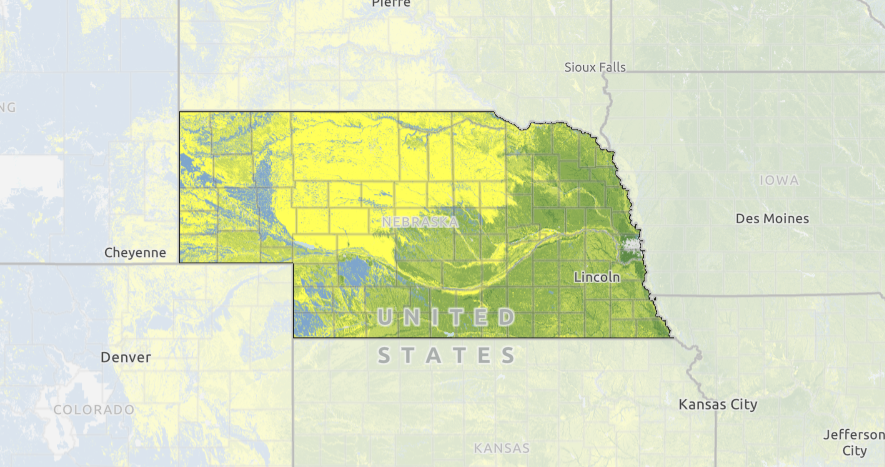
This map shows the ability of soils, landscapes, and climates to foster crop productivity. The are based on productivity for four crops: corn, soybeans, small grains, or cotton.
in: Agricultural Profitability, Livestock Systems, Water and Cropping Systems
-
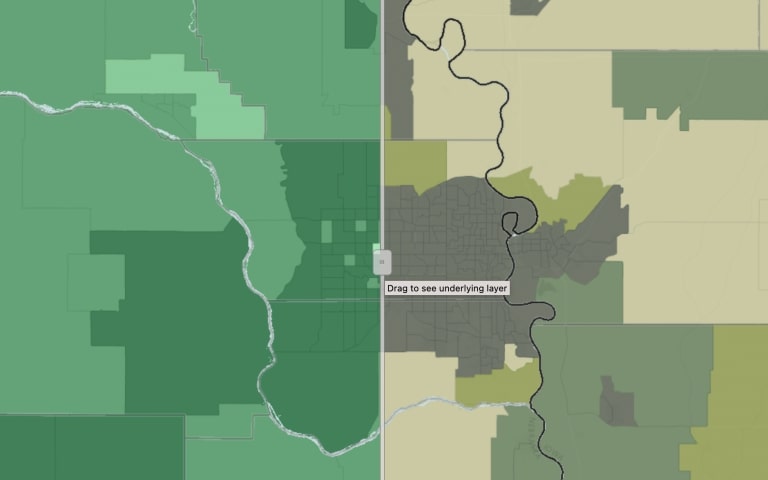
Broadband Access
This map displays broadband access as reported by the American Community Survey and as reported by the Federal Communications Commission.
-
Heat Wave Risk Map
This map shows the heat wave risk by county, as well as the social vulnerability index by county. Counties with overlapping high social vulnerability and increased heat wave risk ratings have populations that are more susceptible to heat-related injuries.
in: Disaster Education, Food, Nutrition & Health, Horticulture, Landscape, and Environmental Systems
-
Nebraska 4-H % Reach by County, 2024
This county-level map displays the percentage of youth reached by 4H programs. The data for the map is sourced from 4H Online.
-
Households Reporting No Internet Access
This map shows households without access to the internet as reported by the American Community Survey.
-
4-H Youth Engagement by County
This map displays the number of youth engaged in 4H clubs by county. Data for this map comes from 4H Online.
-
Broadband Providers and Locations of Public Schools
This map shows broadband providers and locations of public schools.
in: Entrepreneurship
-
Childcare Access
This map shows locations of Head Start facilities and child care centers. The data come from the Administration for Children & Families (ACF) and the Homeland Infrastructure Foundation-Level Data (HIFLD) database. The ACF is a division of the Department of Health & Human Services and works to promote the economic and social well-being of families, children, individuals and communities.
in: 4-H Youth Development, Early Childhood, Entrepreneurship
-
Availability of Fiber Internet and Availability of 100/20mbps Internet
This map shows where fiber internet is reported to be available by the FCC and where internet service at or greater than 100/20mbps is available.
-
Nebraska 4-H % Reach by County, 2023
This county-level map displays the percent of youth reached by 4H programs. The data for the map are sourced from 4H Online.
-
Per Pupil Expenditures
This map shows the per pupil expenditure for each school district in Nebraska. The data are sourced from the Nebraska Department of Education.
in: 4-H Youth Development, Early Childhood, Horticulture, Landscape, and Environmental Systems
-
Cash Rents by Land Type
This map shows cash rent values by type of land. Land types include irrigated cropland, non-irrigated cropland, and pastureland. The data in this map come from the USDA National Agriculture Statistics Service (NASS).
in: Agricultural Profitability, Livestock Systems, Water and Cropping Systems
-
Top Agricultural Commodity by County
This map displays data from the 2022 Census of Agriculture. The data show the top agricultural commodity in each county.
in: Agricultural Profitability, Entrepreneurship, Food, Nutrition & Health, Horticulture, Landscape, and Environmental Systems, Livestock Systems, Water and Cropping Systems
Map Gallery
Filter by: